Introduction
Database performance is one of the most important components for enterprise applications experience. The entire industry, be it web-based ecommerce, social media, cloud services or most other enterprise applications, they use databases. We are writing this guide to assist application developers and database administrators who deploy MySQL* or PostgreSQL* as their backend database on 3rd Generation Intel® Xeon® Scalable Processors based platforms. This guide assumes that the audience has a general working knowledge of the Linux Operating System and either MySQL or PostgreSQL. Our intent is to help the reader to get the best database performance on 3rd Generation Intel® Xeon® Scalable Processors based platform. However, please note that we rely on the users to carefully consider these settings for their specific scenarios, since databases can be deployed in multiple ways. We tested our recommendations with the following configurations:
• MySQL* 8.0.23
• PostgreSQL 13.2
• Ubuntu 20.04.2 LTS
• HammerDB v4.0
• 2-socket 3rd Generation Intel® Xeon® Scalable
3rd Generation Intel® Xeon Scalable Processors Based Platform
3rd Gen Intel® Xeon® Scalable processors deliver industry-leading, workload-optimized platforms with built-in AI acceleration, providing a seamless performance foundation to help speed data’s transformative impact, from the multi-cloud to the intelligent edge and back. Here are some of the features in these new processors:
• Enhanced Performance, up to 40 cores per socket, Single-core turbo frequency up to 3.7 GHz
• Enhanced Intel® Deep Learning Boost with VNNI
• More Intel® Ultra Path Interconnect
• Increased DDR4 Memory Speed & Capacity, up to 6TB System Memory Capacity (Per Socket) DRAM + Intel® Optane™ Persistent Memory 200 series
• Intel® Advanced Vector Extensions
• Intel® Security Essentials and Intel® Security Libraries for Data Center
• Enhanced Intel® Speed Select Technology (Intel SST)
• Support for Intel® Optane™ Persistent Memory (Pmem) 200 series
• Intel® Ethernet Network Adapter E810 series
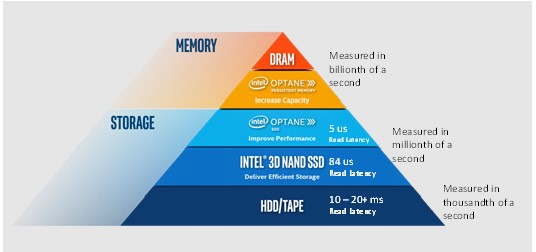
With Intel 3rd Gen Intel® Xeon® Scalable processors and Intel® Optane™ Persistent Memory 200 series, a 2-socket system can support up to 12 TB of system memory. This enables the database administrator to run a super large database size without requiring constant data fetching from storage or network. In addition, pairing with the Intel® 3D NAND SSD D7-P5510 that supports up to 7.68 TB per disk and Intel Optane SSD P5800X with a read and write latency of 5us and 1.5 million IOPS of random read, the 3rd Gen Intel® Xeon® Scalable platform is designed to handle the most demanding enterprise databases, from the smallest to the largest in size. Finally, with the Intel® Ethernet Network Adapter E810 series supporting connection speeds of 100/50/25/10GbE, database backup and restore are done at lightning speed.
Open Source Relational Database Management Systems
Relational database management system (RDBMS) provides some of the most important foundational component in enterprise software architecture. Based on the relational model of data the database software uses the industry standard SQL (Structured Query Language) to define and query the data stored within the relations. Relational databases have proved the most popular format for data storage and retrieval for over 40 years and the RDS (Relational Database Service) continues to be the fastest growing service offered by cloud service providers. The DB-Engines ranking https://db-engines.com/ lists the most popular databases with relational databases making 74% of the total ranking. Relational database workloads are divided into two general categories, OLTP (Online Transaction Processing) and OLAP (Online Analytical Processing) with both workloads having considerably different characteristics.
In this paper we focus upon tuning for OLTP workloads for the two most popular ranked open source RDBMS, MySQL and PostgreSQL. MySQL is the most popular open source RDBMS and has been running on Intel platforms for over 25 years. The latest version 8.0.23 was released January 2021. MySQL supports the use of multiple storage engines definable for table creation. For the highest levels of performance, we recommend upgrading to MySQL 8.0.23 using the InnoDB storage engine to benefit from the latest InnoDB scalability enhancements. Learn more about MySQL at https://www.mysql.com/about/. PostgreSQL is the fastest growing database in popularity for RDBMS and provides the foundation for many enhanced database releases such as Citus*, Greenplum* and EnterpriseDB*. The latest PostgreSQL version is 13 with the current minor version of 13.2. PostgreSQL 13 provides performance and scalability improvements over previous versions and we therefore recommend all customers to move to this version if possible. Learn more about PostgreSQL at: https://www.postgresql.org/about/.
Hardware Tuning
It is critical to select the optimal size of computing resources to meet business needs, from the number of CPU cores to the speed and capacity of the memory and storage. 3rd Gen Intel® Xeon® Scalable processors support up to 40 cores, up to 6 TB of System Memory, and up to 8 memory channels per socket. Table 1 below shows some of the available CPU SKU. In general, the more CPU cores in your system, the more concurrent database users your system can support. CPU frequency is another crucial factor to consider. The faster the frequency, the shorter time it takes to execute a typical operation. When selecting the processor, plan to handle the peak load for your database. Use historical data to estimate peak time requirements -- how many concurrent users must your database services and still meet the service level agreements (SLA). This will help you to determine the number of CPU cores your database requires. A conservative estimate is 1-3 concurrent users per CPU core. For example, if you are running on a system with 64 CPU cores (128 hardware threads with Intel Hyper-Threading Technology enabled), you can expect to support 64-192 concurrent users. Concurrent users are not the total number of users for the system, but the number of users accessing your database at the same time. As for memory, we recommend populating with at least one memory DIMM per channel for best performance. This configuration gives maximum memory bandwidth to feed data to the processors. We recommend a minimum of 64 GB of memory per 1000 warehouses, but it is better to have 128 GB or more for the best user experience.
| Processor SKU | Cores Count per Socket | Total Last Level Cache per Socket (MB) |
Base Frequency (GHz) |
Turbo Frequency (GHz) |
Thermal Design Power (TDP) (W) |
| 2S Intel Xeon Platinum 8380 | 40 | 60 | 2.3 | 3.0 | 270 |
| 2S Intel Xeon Platinum 8352M | 32 | 48 | 2.3 | 2.7 | 185 |
| 2S Intel Xeon Gold 6336Y | 24 | 36 | 2.4 | 3.0 | 185 |
| 2S Intel Xeon Gold 5320T | 20 | 30 | 2.3 | 2.9 | 150 |
| 2S Intel Xeon Silver 4310 | 12 | 18 | 2.1 | 2.7 | 120 |
Table 1. Processor SKU
Other important questions are where to store the data, redo log, and the write-ahead log (WAL), and which media to use? The answer to these questions has a big performance impact. For most use cases, the data will be cached in memory after the database warm up. Therefore, the disk performance is less critical for data tables. Intel® 3D NAND SSD D7-P5510 would be an excellent choice for its large capacity, speed, and low power consumption. For redo log and WAL, however, there will be streams of write operations and can be very performance critical, especially when synchronous commit is used. Redo log and WAL are the most common performance bottlenecks observed by most users. Therefore, we recommend using Intel Optane SSD P5800X for its near memory speed read/write latency. Finally, plan for backup and restore. Connect the systems where you will be doing your database backup and restore to/from with Intel® Ethernet Network Adapter E810 series. This will greatly reduce the time it takes to finish by removing the network bottleneck.
CPU Configuration
Install linux-tools & cpufrequtils which are used to ensure the cpu works properly with turbo boost.
sudo apt-get install linux-tools-generic

sudo apt-get install cpufrequtils
Ubuntu by default has the scaling governor set to “Powersave” mode. For best performance set the scaling governor to “Performance.” Create the following file “/etc/default/cpufrequtils” if it does not already exist and add the given line to the file.
sudo vi /etc/default/cpufrequtils

GOVERNOR="performance"
Restart the cpufrequtils module to set the scaling governor to “performance.” You will also need to disable the ondemand module to prevent it from over-writing the changes on reboot.
systemctl restart cpufrequtils

systemctl disable ondemand
Check that the settings have been applied and the frequency settings as expected. From the following output key things to check are that the driver is shown as intel_pstate, the governor shows as performance, the frequency range goes to the maximum frequency for the CPU and boost state is supported.
Look for the Linux tool in this folder. It will be in a subfolder based on your kernel:
/usr/lib/linux-tools/sudo ./cpupower frequency-info

analyzing CPU 0:

driver: intel_pstate

CPUs which run at the same hardware frequency: 0

CPUs which need to have their frequency coordinated by software: 0

maximum transition latency: Cannot determine or is not supported.

hardware limits: 800 MHz - 3.40 GHz

available cpufreq governors: performance powersave

current policy: frequency should be within 800 MHz and 3.40 GHz.

The governor "performance" may decide which speed to use within this range.

current CPU frequency: Unable to call hardware

current CPU frequency: 1.03 GHz (asserted by call to kernel)

boost state support:

Supported: yes

Active: yes
There is another tool in the directory called x86_energy_perf_policy that determines how the boost states are used. By default, this is set to normal so you will want to set it to performance.
sudo ./x86_energy_perf_policy performance
Disk Configuration
A high performance NVMe drive such as Intel® Optane™ SSD DC P5800X is recommended for storing the database to prevent I/O limitations reducing database throughput in areas such as writes to the WAL files. Installing the database on the SSD DC P5800X will provide higher performance values than using a NAND SSD. Storing the database on Hard Disk Drives (HDD) is not recommended when measuring database performance.
The storage capacity depends on how many warehouses you are going to build. Typically, 1000 warehouse takes 400GB space on the disk.
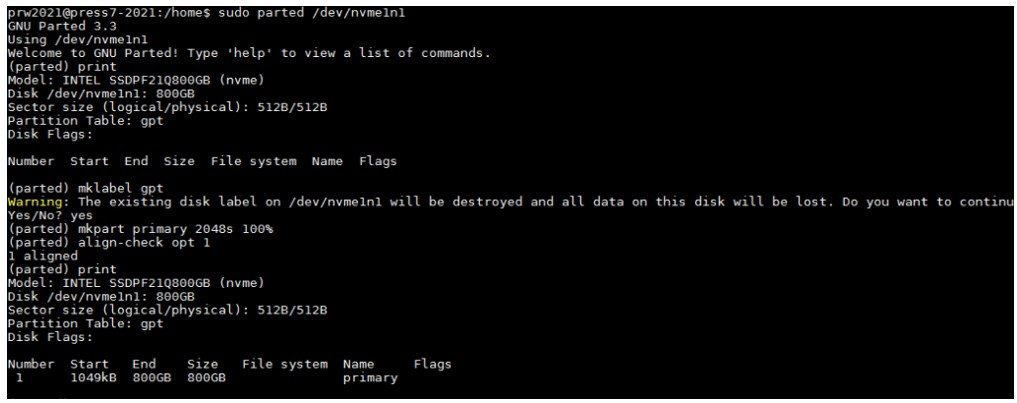
If you are partitioning a drive, the start sector of the very first partition should always be divisible by 4096. Here is an example:
sudo parted /dev/nvme1n1

print

mklabel gpt

mkpart primary 2048s 100%

print

align-check opt 1

q
Example screenshot below
Create a filesystem of your preference on the partition and mount it to the MySQL or PostgreSQL data directory, make sure the mysql or postgres user has the ownership of the directory, an example below.
sudo mkfs.xfs /dev/nvme1n1p1

sudo mkdir /data

sudo mount /dev/nvme1n1p1 /data

sudo chown -R postgres:postgres /data # for postgresql

sudo chown -R mysql:mysql /data # for mysql
Software Tuning
Software configuration tuning is essential. From the Operating System to MySQL and PostgreSQL configuration settings, they are all designed for general purpose applications and default settings are almost never tuned for best performance.
Linux Kernel Optimization
The Operating System manages memory by using pages. The default memory page size for most Linux distributions is 4 KB. This means when running with a database that uses 64GB of memory, the OS must keep track of 16,777,216 pages. Since the CPU cannot keep track of all these pages internally the page tables are stored in memory. Memory access is very slow compared to the CPU, so a cache is kept in the CPU called the Translation Look-aside Buffer (TLB) which keeps the most frequently used pages in the CPU for quick access. With almost 17 million pages, and memory access spread out over a large portion of them, the TLB will be unable to keep all used pages in the cache. To remedy this situation, most modern applications, including MySQL and PostgreSQL, can make use of large pages. Modern x86 CPUs can use a large page size of 2 MB per page or even as large as 1GB per page. If 2 MB pages are used for a 64 GB application memory, the CPU only needs to keep track of 32,768 pages, instead of 16,777,216 pages. Enabling Huge Pages can improve MySQL and PostgreSQL performance. By default, the hugepage size is 2MB, which is fine for MySQL, but 1GB is recommended for PostgreSQL. This should be configured by adding ‘hugepagesz=1G hugepagesz=1G’ to the boot parameters. As an example:
sudo vi /etc/default/grub

GRUB_CMDLINE_LINUX="rhgb default_hugepagesz=1G hugepagesz=1G"

sudo grub2-mkconfig -o /boot/efi/EFI/ubuntu/grub.cfg
A system reboot is required. Check the hugepage size in meminfo after the power cycle.
sudo cat /proc/meminfo
Hugepagesize: 1048576 kB
Next as root add the following line to /etc/sysctl.conf, we are going to create 64GB of buffers (in postgres.conf)) later, so we create 70GB (a little extra) of hugepage area by adding the vm.nr_hugepages line.
vm.swappiness = 0

kernel.sem = 250 32000 100 128

fs.file-max = 6815744

net.ipv4.ip_local_port_range = 9000 65500

net.core.rmem_default = 262144

net.core.rmem_max = 4194304

net.core.wmem_default = 262144

net.core.wmem_max = 1048576

fs.aio-max-nr = 1048576

vm.nr_hugepages = 70
Also edit /etc/security/limits.conf and add the following (assuming the postgres user is created for PostgreSQL database):
postgres soft memlock 100000000

postgres hard memlock 100000000
Now run the command “sysctl –p” as root, when the database is running you will see the memory allocated from huge pages.
cat /proc/meminfo
HugePages_Total: 70
HugePages_Free: 66
HugePages_Rsvd: 62
64GB shared buffers should apply to most cases but you can try increasing it based on your system capability and memory capacity to see if there is any performance improvement, thus you will need to reconfigure hugepages and the limit of locked memory accordingly.
The created hugepage area needs to be larger than PostgreSQL shared buffers and does not go beyond the limit of the locked memory.
MySQL Tuning
MySQL has many tunables to meet different application characteristic. Below are some that we found to work well for most applications.
- Create a conf file at /etc/mysql/my.cnf as in the text below.
sudo vi /etc/mysql/my.cnf

[mysqld]

large-pages

skip-log-bin

datadir=/data

default_authentication_plugin=mysql_native_password

socket=/tmp/mysql.sock

port=3306

bind_address=localhost

# general

max_connections=4000

table_open_cache=8000

table_open_cache_instances=16

back_log=1500

default_password_lifetime=0

ssl=0

performance_schema=OFF

max_prepared_stmt_count=128000

skip_log_bin=1

character_set_server=latin1

collation_server=latin1_swedish_ci

transaction_isolation=REPEATABLE-READ

# files

innodb_file_per_table

innodb_log_file_size=1024M

innodb_log_files_in_group=32

innodb_open_files=4000

# buffers

innodb_buffer_pool_size=64000M

innodb_buffer_pool_instances=16

innodb_log_buffer_size=64M

# tune

innodb_page_size=8192

innodb_doublewrite=0

innodb_thread_concurrency=0

innodb_flush_log_at_trx_commit=0

innodb_max_dirty_pages_pct=90

innodb_max_dirty_pages_pct_lwm=10

join_buffer_size=32K

sort_buffer_size=32K

innodb_use_native_aio=1

innodb_stats_persistent=1

innodb_spin_wait_delay=6

innodb_max_purge_lag_delay=300000

innodb_max_purge_lag=0

innodb_flush_method=O_DIRECT_NO_FSYNC

innodb_checksum_algorithm=none

innodb_io_capacity=4000

innodb_io_capacity_max=20000

innodb_lru_scan_depth=9000

innodb_change_buffering=none

innodb_read_only=0

innodb_page_cleaners=4

innodb_undo_log_truncate=off

# perf special

innodb_adaptive_flushing=1

innodb_flush_neighbors=0

innodb_read_io_threads=16

innodb_write_io_threads=16

innodb_purge_threads=4

innodb_adaptive_hash_index=0

# monitoring

innodb_monitor_enable='%'
The suggested configuration above was optimized for best performance for OLTP workload running on a single node, as measured by HammerDB. For day-to-day operation and reliability, or running in cluster mode, features such as innodb_doublewrite, skip-log-bin, innodb_flush, innodb_flush_method, or innodb_flush_log_at_trx_commit should be adjusted for your particular operating environment and workload. For example, we found that setting innodb_page_size=8k gave the best performance for OLTP application with fast NVMe storage. But if you are running with much slower network storage, you may want to increase to a larger value to reduce the impact from the higher latency. Other settings such as pool size or log file size need to consider your application’s needs and the capacity of the platform that you are running on. While innodb_flush should be enabled in production environment for stability and data integrity, it is good to turn them off to measure CPU performance. Generally enabling innodb_flush cause storage IO to be the bottleneck.
- Apparmor is a security module on Ubuntu that prevents an application from executing scripts, opening ports, accessing & locking files, etc. for protecting the system. When you install MySQL on Ubuntu, Apparmor creates a profile for MySQL. Now if you want to change your data directory location other than the default “/var/lib/mysql”, Apparmor will not allow mysql user to access this data directory even though you would have modified permissions to it using chown & chmod. To avoid this access issue for user defined directories, we can edit the Apparmor policy for MySQL with the required permissions. Edit the following file and reload Apparmor.
sudo vi /etc/apparmor.d/local/usr.sbin.mysqld

/data/ r,

/data/** rwk,
- Reload and restart the Apparmor module
sudo service apparmor reload

sudo service apparmor restart
MySQL Monitoring Tools
For the basic performance monitoring and troubleshooting, ‘top’ and ‘perf top’ are useful. But if you want to do database level performance analysis, innotop is a good real time monitoring tool that gives us ample information about where MySQL server is spending its time.
Useful links:
http://manpages.ubuntu.com/manpages/focal/man1/innotop.1.html
https://github.com/innotop/innotop
Quick steps to install:
1. Install dependencies
sudo apt install libterm-readkey-perl libclass-dbi-perl libclass-dbi-mysql-perl
2.Grab the latest source code from GitHub
wget https://github.com/innotop/innotop/archive/master.zip

mkdir innotop

mv master.zip innotop

cd innotop

unzip master.zip

cd innotop-master/
3. Compile and install
sudo perl Makefile.PL

sudo make install

sudo innotop --version
Here is an example of using innotop.
sudo innotop
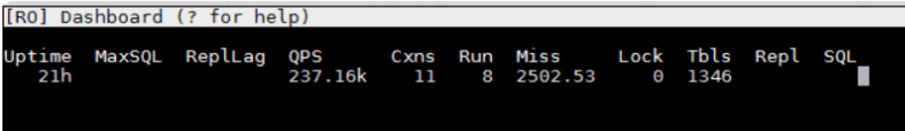
Enter “?” for Help
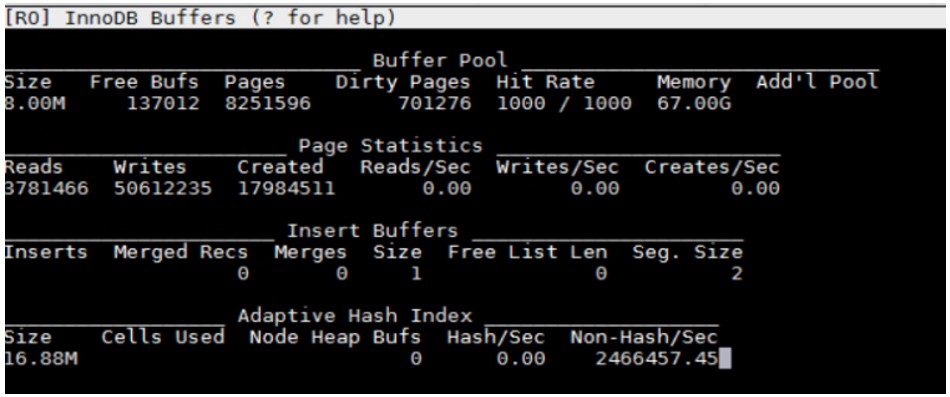
Enter “Q” for Query list
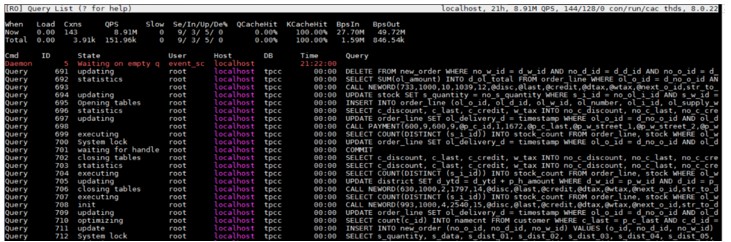
Enter “B” for Innodb Buffers
PostgreSQL Tuning
Write-ahead log (WAL) can have big impact on performance. PostgreSQL by default uses 16MB WAL segment size. For best performance, we recommend increase this size to 1GB.
initdb -D ./data --wal-segsize=1024
To check you can go to pg_wal directory and list the size of wal files.
du -hcs pg_wal/* |more

1.0G 0000000100000A0400000002

1.0G 0000000100000A0400000003

1.0G 0000000100000A0500000000

1.0G 0000000100000A0500000001

1.0G 0000000100000A0500000002

1.0G 0000000100000A0500000003

1.0G 0000000100000A0600000000
PostgreSQL has many other parameters that impact performance. The following PostgreSQL parameters in postgresql.conf could be used as a reference.
cat postgresql.conf

listen_addresses = localhost # what IP address(es) to listen on;

port = 5432 # (change requires restart)

max_connections = 256 # (change requires restart)

shared_buffers = 64000MB # min 128kB

huge_pages = on # on, off, or try

temp_buffers = 4000MB # min 800kB

work_mem = 4000MB # min 64kB

maintenance_work_mem = 512MB # min 1MB

autovacuum_work_mem = -1 # min 1MB, or -1 to use maintenance_work_mem

max_stack_depth = 7MB # min 100kB

dynamic_shared_memory_type = posix # the default is the first option

max_files_per_process = 4000 # min 25

effective_io_concurrency = 32 # 1-1000; 0 disables prefetching

wal_level = minimal # minimal, archive, hot_standby, or logical

synchronous_commit = on # synchronization level;

wal_buffers = 512MB # min 32kB, -1 sets based on shared_buffers

cpu_tuple_cost = 0.03

effective_cache_size=350GB

random_page_cost = 1.1

checkpoint_timeout = 1h # range 30s-1h

checkpoint_completion_target = 0.9 # checkpoint target duration, 0.0 - 1.0

checkpoint_warning = 1

log_min_messages = error # values in order of decreasing detail:

log_min_error_statement = error # values in order of decreasing detail:

autovacuum = on # Enable autovacuum subprocess? 'on'

autovacuum_max_workers = 10

autovacuum_vacuum_cost_limit = 3000

datestyle = 'iso, dmy'

lc_messages = 'en_US.UTF-8' # locale for system error message

lc_monetary = 'en_US.UTF-8' # locale for monetary formatting

lc_numeric = 'en_US.UTF-8' # locale for number formatting

lc_time = 'en_US.UTF-8' # locale for time formatting

default_text_search_config = 'pg_catalog.english'

max_locks_per_transaction = 64 # min 10

max_pred_locks_per_transaction = 64 # min 10

archive_mode=off

max_wal_senders=0

min_wal_size=8192

max_wal_size=524288
PostgreSQL user guide suggests a reasonable starting value for shared_buffers to be 25% of the memory in your system. Make sure to enable hugepage and Operating System memory limits accordingly. We also recommend enabling autovacuum to avoid performance dips at very high transaction rate.
It’s worth noting that ‘synchronous commit’ specifies whether transaction commit will wait for WAL records to be written to disk before responding back to the client. In production database environments synchronous commit should be enabled. However, when assessing CPU performance, as opposed to I/O performance, you will want to disable ‘synchronous commit’ to remove I/O performance from being the bottleneck.
PostgreSQL Performance Monitoring
For the basic performance monitoring and troubleshooting, ‘top’ and ‘perf top’ are useful. But if you need analysis at the database level, pg_stat_statements and pg_sentinel are more advanced PostgreSQL tools to use.
Useful links:
https://www.postgresql.org/docs/9.4/pgstatstatements.html
https://github.com/pgsentinel/pgsentinel
Quick steps to install:
1. Install pg_stat_statements
cd postgresql-13.0/contrib

sudo make

cd postgresql-13.0/contrib/pg_stat_statements

sudo make

sudo make install
2. Install pgsentinel
export PATH=$PATH:/usr/local/pgsql/bin

git clone https://github.com/pgsentinel/pgsentinel.git

cd pgsentinel/src

sudo make

sudo make install
3. Configuration
Add the following to postgres.conf, a database restart is needed.
shared_preload_libraries = 'pg_stat_statements,pgsentinel'

# Increase the max size of the query strings Postgres records

track_activity_query_size = 2048

# Track statements generated by stored procedures as well

pg_stat_statements.track = all
4. Create extensions.
postgres=# create extension pg_stat_statements;

CREATE EXTENSION

postgres=# create extension pgsentinel ;

CREATE EXTENSION

postgres=# \dx
List of installed extensions
Name | Version | Schema | Description
--------------------+---------+------------+-----------------------------------------------------------
pg_stat_statements | 1.6 | public | track execution statistics of all SQL statements executed
pgsentinel | 1.0b | public | active session history
plpgsql | 1.0 | pg_catalog | PL/pgSQL procedural language
5. Right after a HammerDB test, run the following example statement.
postgres=#

with ash as (

select *,ceil(extract(epoch from max(ash_time)over()-min(ash_time)over()))::numeric samples

from pg_active_session_history where ash_time>=current_timestamp - interval '2 minutes'

) select round(100*count(*)/sum(count(*)) over(), 0) as "%", round(count(*)::numeric/samples,2) as "AAS",

backend_type,wait_event_type,wait_event

from ash

group by samples,

backend_type,wait_event_type,wait_event

order by 1 desc fetch first 20 rows only

;
It outputs the captured wait events like this:
% | AAS | backend_type | wait_event_type | wait_event
----+-------+----------------+-----------------+----------------------
48 | 28.00 | client backend | CPU | CPU
12 | 6.82 | client backend | LWLock | XactSLRU
11 | 6.18 | client backend | LWLock | WALInsert
9 | 5.41 | client backend | IPC | ProcArrayGroupUpdate
6 | 3.71 | client backend | Client | ClientRead
6 | 3.65 | client backend | IPC | XactGroupUpdate
5 | 2.82 | client backend | Lock | extend
2 | 0.94 | client backend | LWLock | ProcArray
1 | 0.35 | client backend | IPC | CheckpointDone
Performance Testing
HammerDB is a leading open source relational database load testing and benchmarking tool used by many database professionals to stress and benchmark the most popular relational databases both commercial and open source. HammerDB supports testing of both MySQL and PostgreSQL with workloads based on industry standard specifications and is hosted by the industry standard body the TPC (Transaction Processing Performance Council). HammerDB implements both OLTP and OLAP workloads, in this paper we focus on the OLTP workload called TPROC-C. TPROC-C means "Transaction Processing Benchmark derived from the TPC "C" specification" and is the OLTP workload implemented in HammerDB derived from the OLTP TPC-C specification with modifications to make running HammerDB considerably more straightforward and cost-effective than adhering strictly to the specification whilst still delivering valuable insights into relational database performance. Such a workload lowers the barrier to entry for database benchmarking to make comparison of database performance reliable and predictable yet also widely available.
The HammerDB TPROC-C test result produces two key metrics, New Orders Per Minute (NOPM) and Transactions Per Minute (TPM). NOPM is a close relation of the official tpmC statistic recording only new orders per minute and is the recommend metric to use to measure database performance being comparable between different databases. TPM is a complementary metric used to measure the performance of a specific database engine and relate performance to other statistics generated by that engine. Learn more about HammerDB here: https://www.hammerdb.com/about.html.
Conclusion
We understand every application is unique. We shared many of our experiences with MySQL and PostgreSQL hoping that some of our learnings could be applied to your specific application. Both Open Source relational database management systems have been well tested on Intel platforms. With 3rd Generation Intel® Xeon® Scalable processor, Intel takes it even further by optimizing the platform as a whole -- CPU, memory, storage, and networking working together for the best user experience.
Appendix A – Installing HammerDB 4.0
- Download “HammerDB-4.0-Linux.tar.gz” from the following link.
https://github.com/TPC-Council/HammerDB/releases/download/v4.0/HammerDB-4.0-Linux.tar.gz
- Extract the files.
cp HammerDB-4.0-Linux.tar.gz ~/home

tar -xvzf HammerDB-4.0-Linux.tar.gz
Appendix B – Running HammerDB 4.0 with MySQL
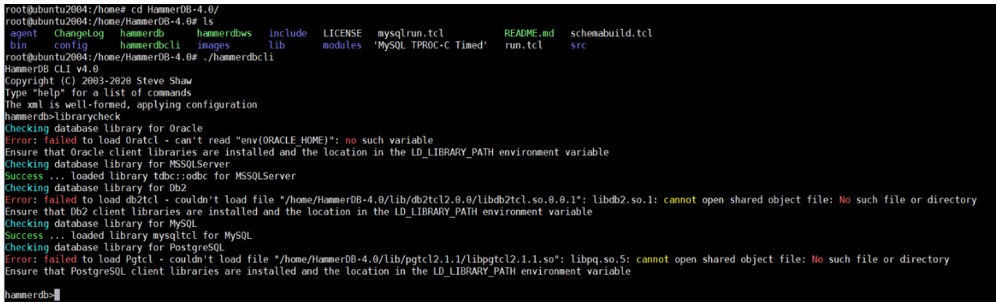
- Check if MySQL client libraries are present.
cd /home/HammerDB-4.0

./hammedbcli

librarycheck

exit
- Example below. Make sure it says “Success’ for MySQL Database
- However, in case it isn’t installed. Download the appropriate libmysqlclient ((libmysqlclient-dev_8.0.23-1ubuntu20.04_amd64.deb) specific to your OS and MySQL version from the link
https://dev.mysql.com/downloads/mysql/ and export the path where libmysqlclient is stored. Example below:
export LD_LIBRARY_PATH=/home/mysql:$LD_LIBRARY_PATH

chmod 644 libmysqlclient.so.21

chown mysql:mysql libmysqlclient.so.21
- To run the workload, we first need to build schema using schemabuild.tcl script. This script will take about 30 minutes to create the database depending upon the system and drives you are using.
sudo ./hammerdbcli auto schemabuild.tcl
Example script below:
schemabuild.tcl
sudo vi schemabuild.tcl

puts "SETTING CONFIGURATION"

dbset db mysql

diset connection mysql_host localhost

diset connection mysql_port 3306

diset tpcc mysql_count_ware 1000

diset tpcc mysql_partition true

diset tpcc mysql_num_vu 256

diset tpcc mysql_storage_engine innodb

print dict

vuset logtotemp 1

vuset unique 1

buildschema

waittocomplete
- To do a test, run the mysqlrun.tcl script. Each test should take about 7 to 8 minutes.
sudo ./hammerdbcli auto mysqlrun.tcl
Example script below.
mysqlrun.tcl
sudo vi mysqlrun.tcl

puts "SETTING CONFIGURATION"

dbset db mysql

diset connection mysql_host localhost

diset connection mysql_port 3306

diset tpcc mysql_driver timed

diset tpcc mysql_prepared false

diset tpcc mysql_rampup 2

diset tpcc mysql_duration 5

vuset logtotemp 1

vuset unique 1

loadscript

puts "TEST STARTED"

vuset vu 64

vucreate

vurun

runtimer 500

vudestroy

puts "TEST COMPLETE"
In the above example, we are simulating 64 concurrent users accessing the database. You need to adjust the vuset vu value to represent the database size that you are testing.
The results can be found at end of the script and are also logged in /tmp/hammerdb_*.log with a unique name.
Appendix C – Running HammerDB with PostgreSQL
To run the workload, we first need to build schema using pgbuild.tcl script. In this example this would take around 30 minutes depending on your system configuration.
sudo ./hammerdbcli auto pgbuild.tcl
Example of the schema build script:
cat pgbuild.tcl

dbset db pg

dbset bm TPC-C

diset connection pg_host localhost

diset conection pg_port 5432

diset tpcc pg_count_ware 1000

diset tpcc pg_num_vu 180

diset tpcc pg_superuser intel

diset tpcc pg_superuserpass postgres

diset tpcc pg_storedprocs false

vuset logtotemp 1

vuset unique 1

buildschema

waittocomplete
To run a test with a single number of virtual users, run the pgtest.tcl script.
sudo ./hammerdbcli auto pgtest.tcl
Example of the test script:
cat pgtest.tcl

puts "SETTING CONFIGURATION"

dbset db pg

diset connection pg_host localhost

diset connection pg_port 5432

diset tpcc pg_superuser intel

diset tpcc pg_superuserpass postgres

diset tpcc pg_vacuum true

diset tpcc pg_driver timed

diset tpcc pg_rampup 2

diset tpcc pg_duration 2

diset tpcc pg_storedprocs false

vuset logtotemp 1

vuset unique 1

loadscript

puts "TEST STARTED"

vuset vu 64

vucreate

vurun

runtimer 300

vudestroy

puts "TEST COMPLETE"
The results can be found at end of the script and are also logged in /tmp/hammerdb_*.log with a unique name.
Vuser 1:64 Active Virtual Users configured
Vuser 1:TEST RESULT : System achieved 1483849 NOPM from 3515684 PostgreSQL TPM
Notices & Disclaimers
Intel technologies may require enabled hardware, software or service activation.
No product or component can be absolutely secure.
Your costs and results may vary.
Code names are used by Intel to identify products, technologies, or services that are in development and not publicly available. These are not "commercial" names and not intended to function as trademarks
The products described may contain design defects or errors known as errata which may cause the product to deviate from published specifications. Current characterized errata are available on request.
© Intel Corporation. Intel, the Intel logo, and other Intel marks are trademarks of Intel Corporation or its subsidiaries. Other names and brands may be claimed as the property of others.