Visible to Intel only — GUID: GUID-81DCD3A7-BB3B-4099-BDFF-641C593E1907
Introduction to Intel® Graphics Performance Analyzers
Game Optimization Methodology
Install and Launch Intel® GPA
Enable System-wide Time-based GPU Metrics and Enable Query-based Metrics for OpenGL* in Graphics Frame Analyzer for Ubuntu*
Launch Application for Analysis
Configure Analysis Settings
Quick Start with Profiling Unreal Engine* Games
Analyze Desktop Graphics Applications
Instrumentation and Tracing Technology API Support
Intel® GPA Reference
Notices and Disclaimers
Visible to Intel only — GUID: GUID-81DCD3A7-BB3B-4099-BDFF-641C593E1907
Visualize Color Distribution
Investigate the texture color data using the color histogram in Graphics Frame Analyzer. Such analysis is useful for debugging and helps you to check whether your shading algorithms work as expected.
Depending on the format type, the pixel values of your texture or render target have different default ranges:
- For floating-point texture formats, the default range is [0, 1].
- For integer formats, the range spans from the minimum to the maximum value.
If the pixel values you are interested in lie within a range much smaller than default, it's hard to see the details of the image with the naked eye. In this case, try the following:
- Select the texture or render target from the list of resources and click the
 button to open the histogram.

You can see color intensity values on the X-axis, and the number of pixels with the given intensity on the Y-axis.
- Analyze color distribution within the frame. Hover over the image to see the pixel values below. On the right, you can also see:
- Original values used to store pixel information in memory - the same as shown below the image, but in a more precise format.
- Normalized values used in shaders.
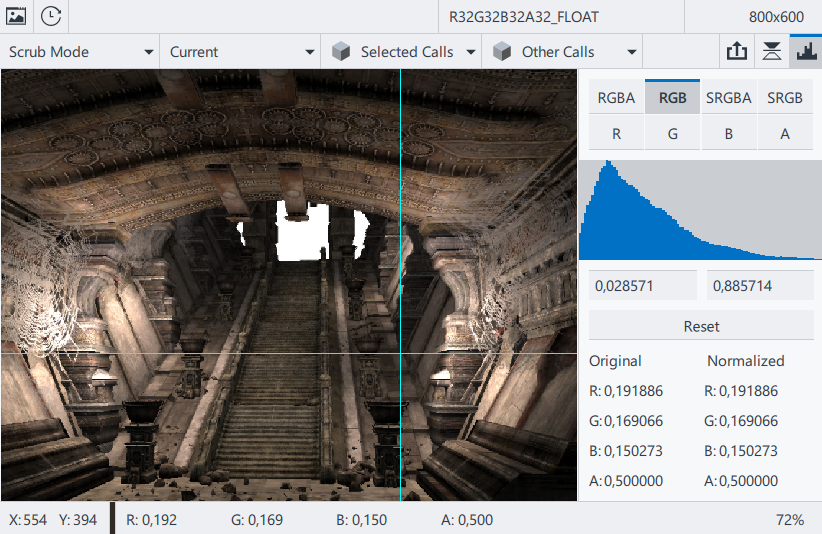
- Drill down to the color range you are interested in:
- Select it in the histogram
- Type the threshold pixel values below the histogram
The image updates to show the data for the selected range only.
You can also navigate inside the histogram:
- Zoom in/out of the selected range using the mouse wheel.
- Scroll left/right by clicking and dragging the mouse while holding Ctrl.
- If required for better visualization, toggle between available channels and channel configurations:
- RGB mode includes all main color channels. RGBA and SRGBA also include alpha channel. SRGB and SRGBA also include gamma correction.
- Red/Green/Blue color channels show the image information in red/green/blue color plane.
This is useful to investigate each color channel separately when they contain different data. For example, one of the channels may be responsible for smoothness of rendered objects, and therefore their ability to reflect light.
- Alpha channel is a grayscale conversion of the alpha data of the buffer.
With alpha channel, you can analyze transparency of rendered objects.
- Click the Reset button to return the histogram to the full view and select a different range, if needed.
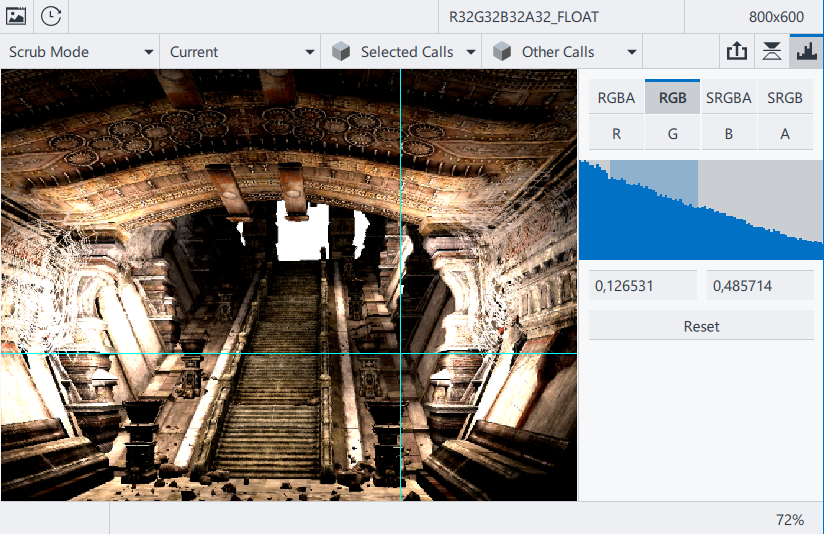
If the pixel values of your floating-point texture/render target lie outside the default range [0, 1], you may not see some parts of the image. Using the histogram, you can detect the actual range, and then drill down to the sub-range of interest:
- Open the histogram for the selected texture/render target.
Since the RGB mode shows the default color range, some of the data is not displayed.
- Select the color channel with the widest range and click Reset.
The histogram updates to include the entire available range.
- Change the color channel back to the RGB mode.
Switching color channels does not affect the range selection, so you can now view the full image with the actual range selected.
NOTE:
When analyzing textures/render targets that use 5-6-5 or similar formats, remember that color channels have different ranges, whish are not updated automatically:
- [0, 32] for the Red channel
- [0, 64] for the Green channel
- [0, 32] for the Blue channel
Since the data from Red, Green, and Blue channels is taken in different proportions for calculating intensity values in RGB mode, peak values in the histogram for RGB mode do not coincide with those for separate color planes.
Parent topic: Optimize Specific Domains